
Dashboard tour
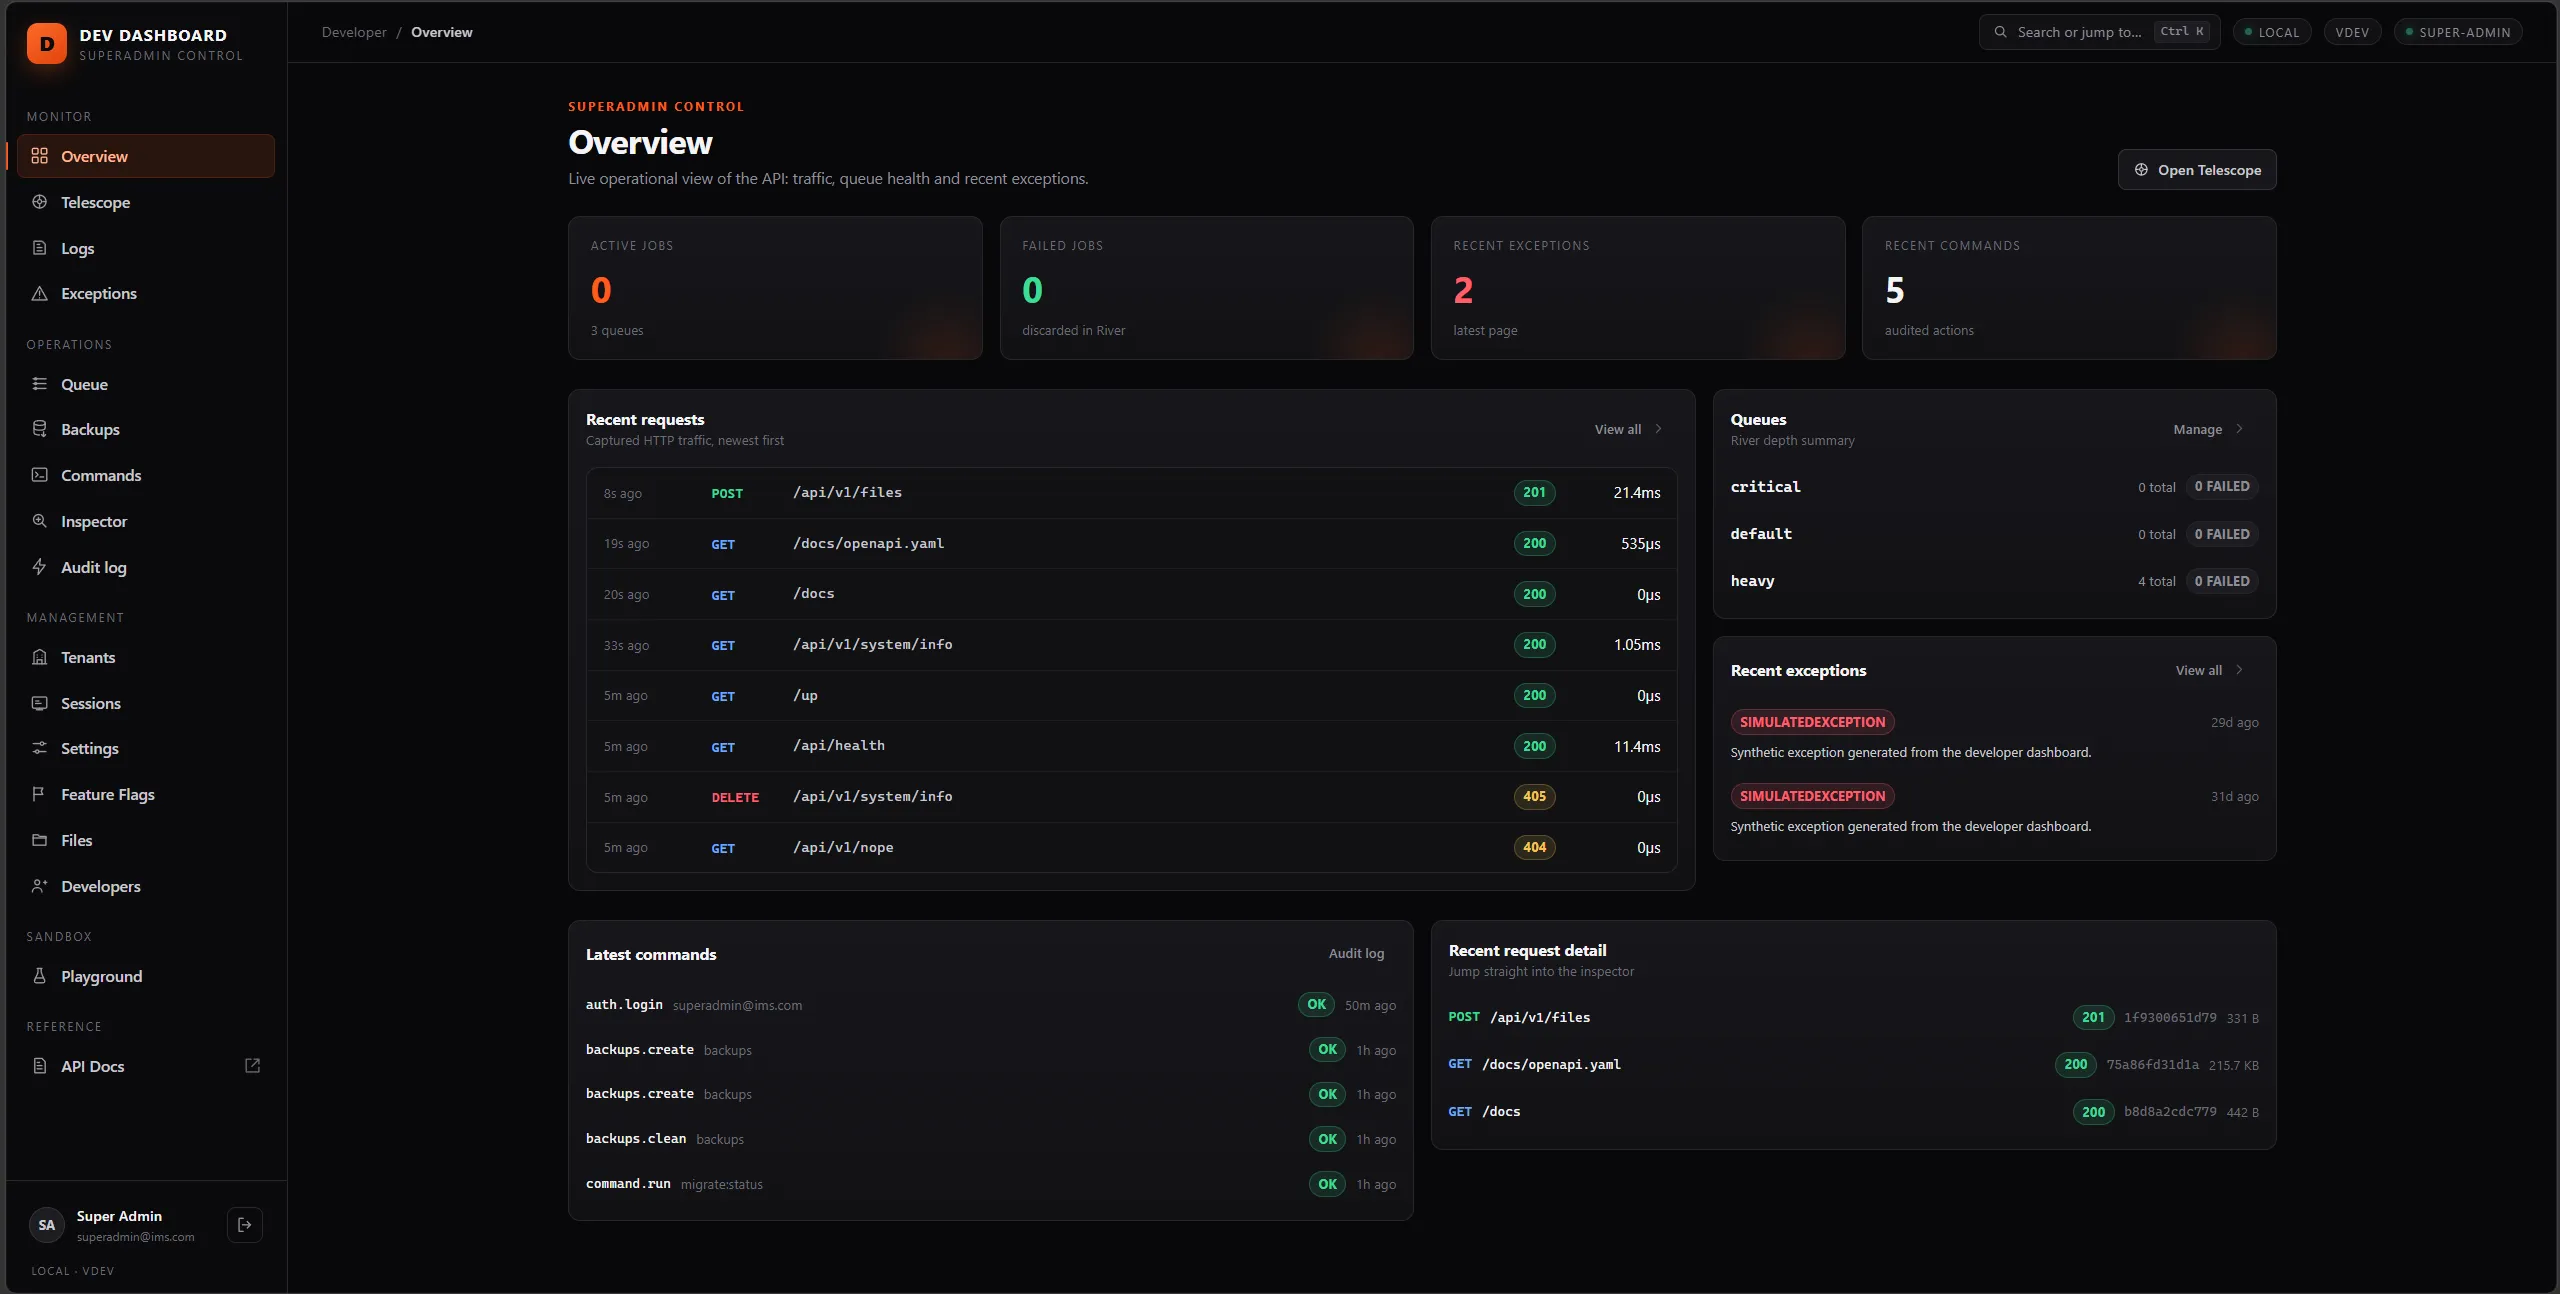
The developer dashboard is a React app embedded in the binary and served at /dev. Think of
Laravel Telescope, Horizon and a slice of Nova in one place, for the people who build and run the
API — not for your customers.
Who can open it
| Setting / permission | Effect |
|---|---|
DEV_DASHBOARD_ENABLED |
on by default outside production; off in production unless you set it |
dev.view |
open the dashboard and read every panel |
dev.manage |
anything that changes something — every such action is audited |
The seeded Developer role (developer@ims.com) has both; the super admin can do everything.
Disabled deployments answer 404 at /dev before any authentication.
Ctrl+K (⌘K) opens the command palette from anywhere: jump to any panel, Inspector tab, command or record.
Monitor
| Panel | Shows |
|---|---|
| Overview | active and failed jobs, recent exceptions and commands, the latest requests, queue depth |
| Telescope | every captured request — headers, bodies (redacted), the SQL it ran, cache calls, jobs it enqueued, timing |
| Logs | warn-and-above log lines with full-text search, level and date filters |
| Exceptions | panics and 5xx with stack traces and the request that caused them |
Operations
| Panel | Does |
|---|---|
| Queue | queues and jobs by state; pause/resume queues; retry, cancel or delete jobs. Shows the job envelope, never the payload |
| Backups | runs with size, checksum and destinations; create, clean, download (dev.manage) |
| Commands | runs the allowlisted maintenance commands in-process, with options, confirmation, background runs and output history |
| Inspector | System (health checks + runtime), Routes (every route with its middleware and permission), Roles & permissions (catalog vs database drift), Config (effective values, secrets masked), Packages (Go and npm dependencies) |
| Audit log | every dashboard action and sign-in (including failures — never the password) with IP and browser; filter by action, person, status and date |
Management
| Panel | Does |
|---|---|
| Tenants | every tenant with its plan, usage against limits (users 2 / 1 in red when over) and override counts; deep links to its settings and flags |
| Sessions | active tokens per user; revoke one, a user’s, or all |
| Settings | every setting with its global value and per-tenant overrides; inline edit; drag keys between groups and reorder groups |
| Feature Flags | every flag per target (global, tenant, user) with a rollout slider |
| Files | every file across disks with thumbnails, previews (images, PDFs) and filters |
| Developers | who has dashboard access; grant or remove the Developer role |
Sandbox
Playground (local only) enqueues sample jobs and generates sample logs and exceptions, so you can see every panel populated without real traffic.
How it is built
- The SPA lives in
web/dev(React, TanStack Router and Query, cmdk for the palette) and is embedded withgo:embed; release builds include it, so production needs no Node. - Its JSON API is
/dev/api/*(internal/modules/dev), documented inapi/openapi.yamllike the rest of the API. - Handlers call panel services (
services.go,inspector.go,commands.go); every mutation is recorded indev_actions, kept forDEV_DASHBOARD_AUDIT_RETENTION_DAYS(default 180). - Telemetry comes from the collector described in Health & observability.
To add a panel, command or palette entry, see Extending the dashboard.